
Wara Samar
22nd May 2025
How Zapyrus Intelligence Helps MedTech Service Providers Win in a Volatile Market
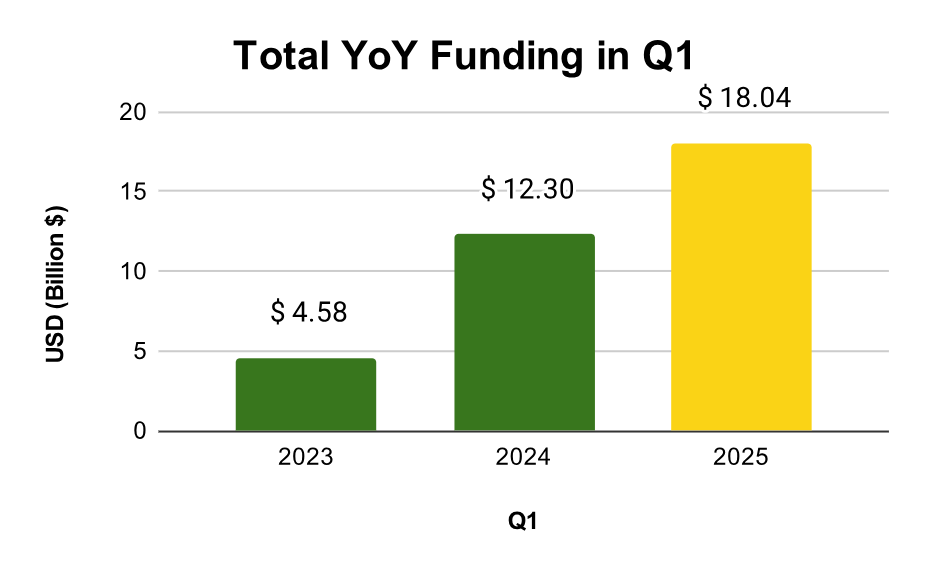
According to the Zapyrus 2025 Q1 financial data, the MedTech sector secured an impressive $18 billion in funding during the first quarter alone, marking a 47% increase over Q1 2024. However, this financial upswing doesn’t automatically translate into predictable growth for every MedTech stakeholder. For service providers like contract research organizations (CROs), regulatory consultants, manufacturers, and commercialization experts, the challenge lies in identifying which companies are not only well-capitalized but also on the cusp of requiring external support. The key? Actionable, data-driven intelligence.
The Zapyrus platform, built to parse massive volumes of funding and company-level data, delivers precisely this insight. Rather than relying on instinct or outdated directories, MedTech service providers can now align their outreach with predictive signals about clinical activity, regulatory filings, and commercialization plans. In a high-risk, high-reward environment, precision targeting isn’t optional; it’s essential.
Q1 2025 Funding Snapshot: A Booming Start, But Who’s Getting the Money?
Historically, Q1 sets the tone for annual performance in MedTech funding. This year, it exceeded expectations. The $18 billion raised comprises grants, seed and venture capital, public offerings, and IPOs. Notably, 26 MedTech companies secured funding rounds of $100 million or more, up from 14 in Q1 2024 and just 6 in Q1 2023.
While these figures demonstrate the sector’s post-COVID-19 rebound, raw totals only tell part of the story. Understanding the nature, distribution, and purpose of these funds is what transforms passive data into usable intelligence.
For example, funding round analysis shows an exponential drop in the number of recipients as the funding amount increases. This means that while later-stage companies attract larger checks, fewer early-stage players are receiving capital, possibly foreshadowing the effects of NIH budget cuts. Grant funding remains robust, rivaling or exceeding levels seen in seed, Series D, and Series E+ rounds.
Importantly, $11 billion of the total came from non-IPO public offerings, indicating strong investor interest in mature MedTech firms. But this also shifts the landscape of opportunity: service providers need to know where their value is most urgently needed, and that varies by company stage and structure.
Company Size Matters: Where Should Service Providers Focus?
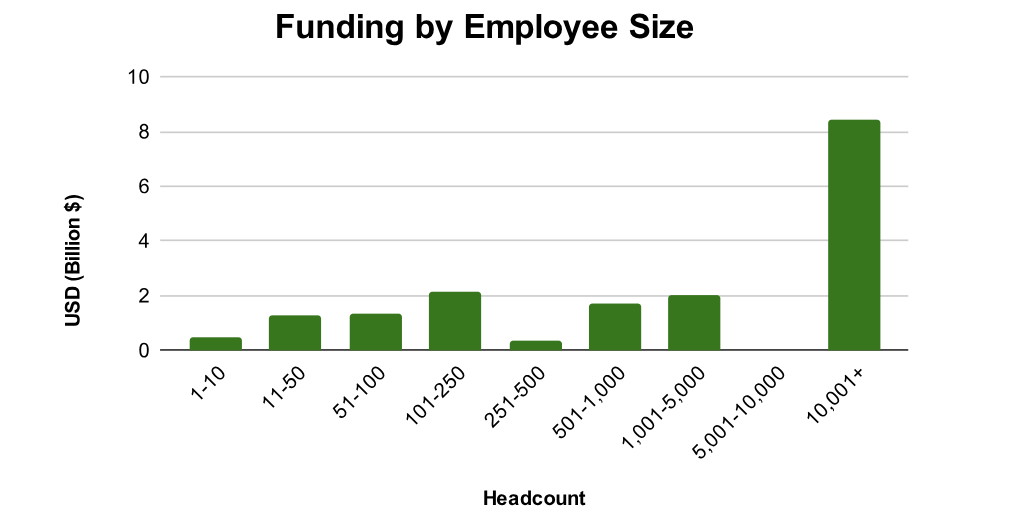
Zapyrus data reveals that 52% of Q1 funding went to companies with over 10,000 employees, clear evidence of incumbents doubling down on innovation. But the other half of funding wasn’t evenly spread across smaller firms. Companies with 11–250 and 500–5,000 employees saw relatively balanced funding, while those with fewer than 10 or between 251–500 employees received significantly less.
For service providers looking to tap into earlier-stage firms, this is a wake-up call. Without a targeted, data-backed approach, efforts to reach the right startups may be inefficient or even fruitless.
Instead, mid-market firms—especially those with 500 to 5,000 employees—appear well-positioned for growth. They combine financial strength with a probable need for external expertise, making them prime candidates for regulatory, clinical, and commercial partnerships in the coming months.
Therapeutic Areas: Cardiovascular Leads, but SaMD Emerges as a Game-Changer
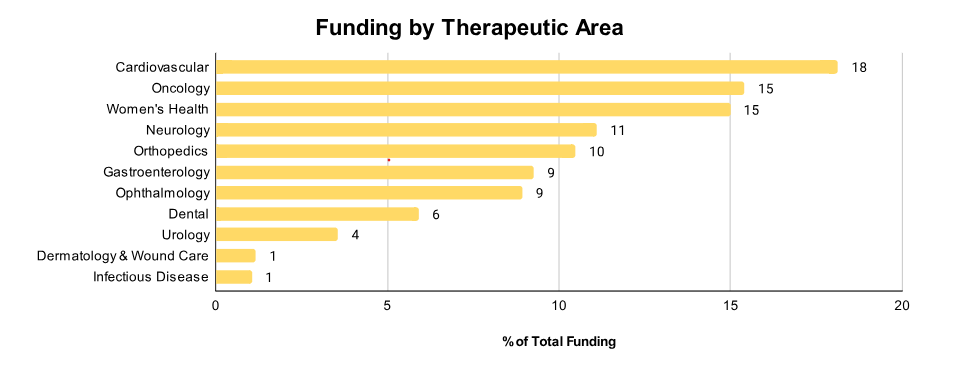
Cardiovascular technologies claimed 18% of Q1 2025 funding, holding their position as the most well-funded therapeutic area (TA). Oncology and women’s health followed closely at around 15% each. The ongoing rise in women’s health investment, highlighted in the Zapyrus 2024 annual report, signals a sustained opportunity for providers who can cater to gender-specific medical innovation.
Other high-opportunity TAs include neurology, orthopedics, gastroenterology, and ophthalmology. In contrast, wound care and infectious diseases saw the lowest funding, a likely reflection of their lower regulatory and commercialization thresholds.
The most significant shift, however, is technological: Software as a Medical Device (SaMD) funding has surged more than fivefold this quarter, surpassing even in vitro diagnostics (IVD). With increased computing power, reduced costs, and the growing integration of AI, SaMD is no longer a niche; it’s a primary growth vector.
Service providers not yet aligned with the regulatory, clinical, and commercialization nuances of SaMD risk falling behind. The need for expertise in this fast-evolving category will only accelerate over the next 5 years.
Also Read: European MedTech Fundraising Highlights: Insights from Zapyrus’ Global Intelligence
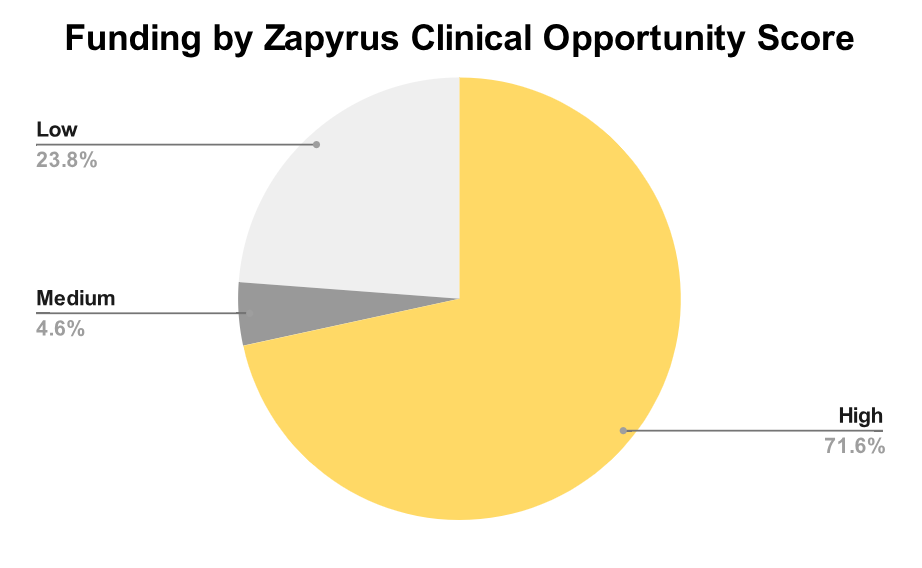
Zapyrus Clinical Opportunity Score: Predictive Precision at Work
What truly sets Zapyrus apart is its Clinical Opportunity Score, a proprietary indicator of whether a MedTech company is likely to initiate a clinical study within 6–12 months. This quarter, 72% of funded companies scored high, suggesting imminent demand for clinical services. Another 5% landed in the medium range, while 24% showed low likelihood.
For CROs, eClinical platforms, CMOs, and commercialization firms, this signal is not just informative—it’s actionable. It enables focused outreach to companies most likely to convert into revenue-generating clients in the near term.
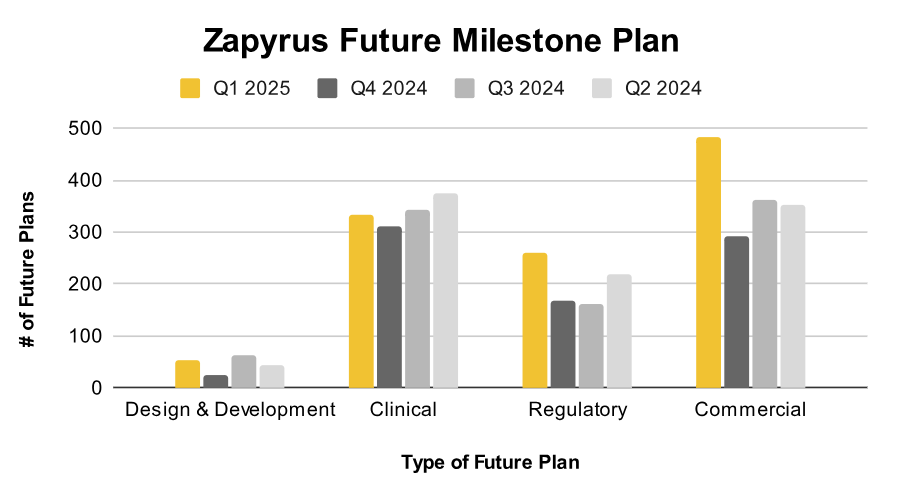
In parallel, Zapyrus’ “Future Plan” machine learning models track signals related to design and development (D&D), clinical studies, regulatory submissions, and commercialization. Trends show that the volume of D&D plans in Q1 2025 matches that of Q2 2024, historically a precursor to spikes in clinical and regulatory activity.
Spotlight on Major Players: Why Big Funding Doesn’t Always Mean Broad Opportunity
While macro-level trends are vital, context matters. The Q1 surge in regulatory future plans is largely attributed to a $4.2 billion round raised by Edwards Lifesciences aimed at CE marking. Likewise, Boston Scientific’s $1.6 billion earmarked for future clinical studies skewed clinical future plan signals upward.
Service providers must distinguish between market-wide movements and company-specific outliers. Though these deals inflate total volumes, removing them from the dataset still reveals a general uptick in funding tied to clinical and regulatory activity: a bullish signal for providers attuned to these trends.
Emerging Companies: Fewer Bets, Bigger Commitments
Interestingly, the number of emerging companies (those with <50 employees, pre-commercial, and backed by early-stage capital) receiving funding continues to decline. But when investors do back them, they commit more capital than in previous years.
This shift reflects greater scrutiny and selectivity but also deeper confidence in companies that pass the bar. For MedTech service providers, the implication is clear: early-stage opportunity still exists, but finding it requires real-time, granular data. Visibility into funding type, employee count, and future milestone planning is critical to identifying which startups are truly worth engaging in.
Class III Devices: Clinical Activity on the Horizon
Investment in Class III devices has been rising steadily since Q4 2023 and now appears to have stabilized at a high level. This aligns with spikes in clinical and regulatory plans, reinforcing the outlook for a busy mid-year in trial initiation and regulatory submissions.
Because Class III devices typically carry the highest regulatory burden, companies in this space are ideal candidates for outsourced services. Zapyrus data enables service providers to pinpoint these firms well before they hit key milestones, allowing them to offer support at exactly the right moment.
Also Read: Asia Family Office Foundation Joins MedTech World’s Hong Kong Roadshow
Commercial-Stage Dominance: A Window for Long-Term Partnerships
An overwhelming 77% of Q1 2025 funding went to commercial-stage companies. These are firms that have already proven product-market fit and are now seeking capital to scale new pipelines. For service providers, this is promising: such companies are not only financially stable, but also more likely to pursue strategic partnerships across regulatory, clinical, and manufacturing functions.
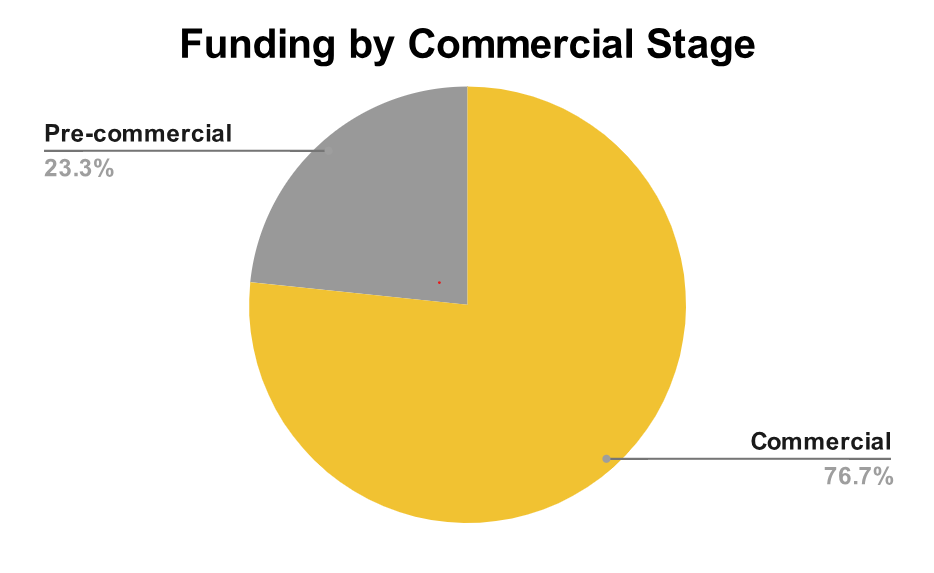
By contrast, just 23% of the funding went to pre-commercial companies, again reinforcing the need for targeted prospecting.
Conclusion: Strategy Begins with Better Data
The MedTech market is booming, but that doesn’t make it easy. For service providers, the Q1 2025 Zapyrus funding report delivers a clear mandate: opportunity exists, but only for those equipped to find it.
Zapyrus’ intelligence tools, such as its Clinical Opportunity Score, future milestone signals, and funding analytics by company size, therapeutic area, and technology type, offer a competitive edge that goes beyond observation to prediction.
In 2025, success won’t be defined by how fast service providers can react. It will be determined by how accurately they can anticipate.
Watch Kevin Saem, Zapyrus Brand Founder, moderate the panel ‘The AI MedTech Dialogue’ during MedTech Malta 2024 here: